
Hourly DAM/IDM chart and signals
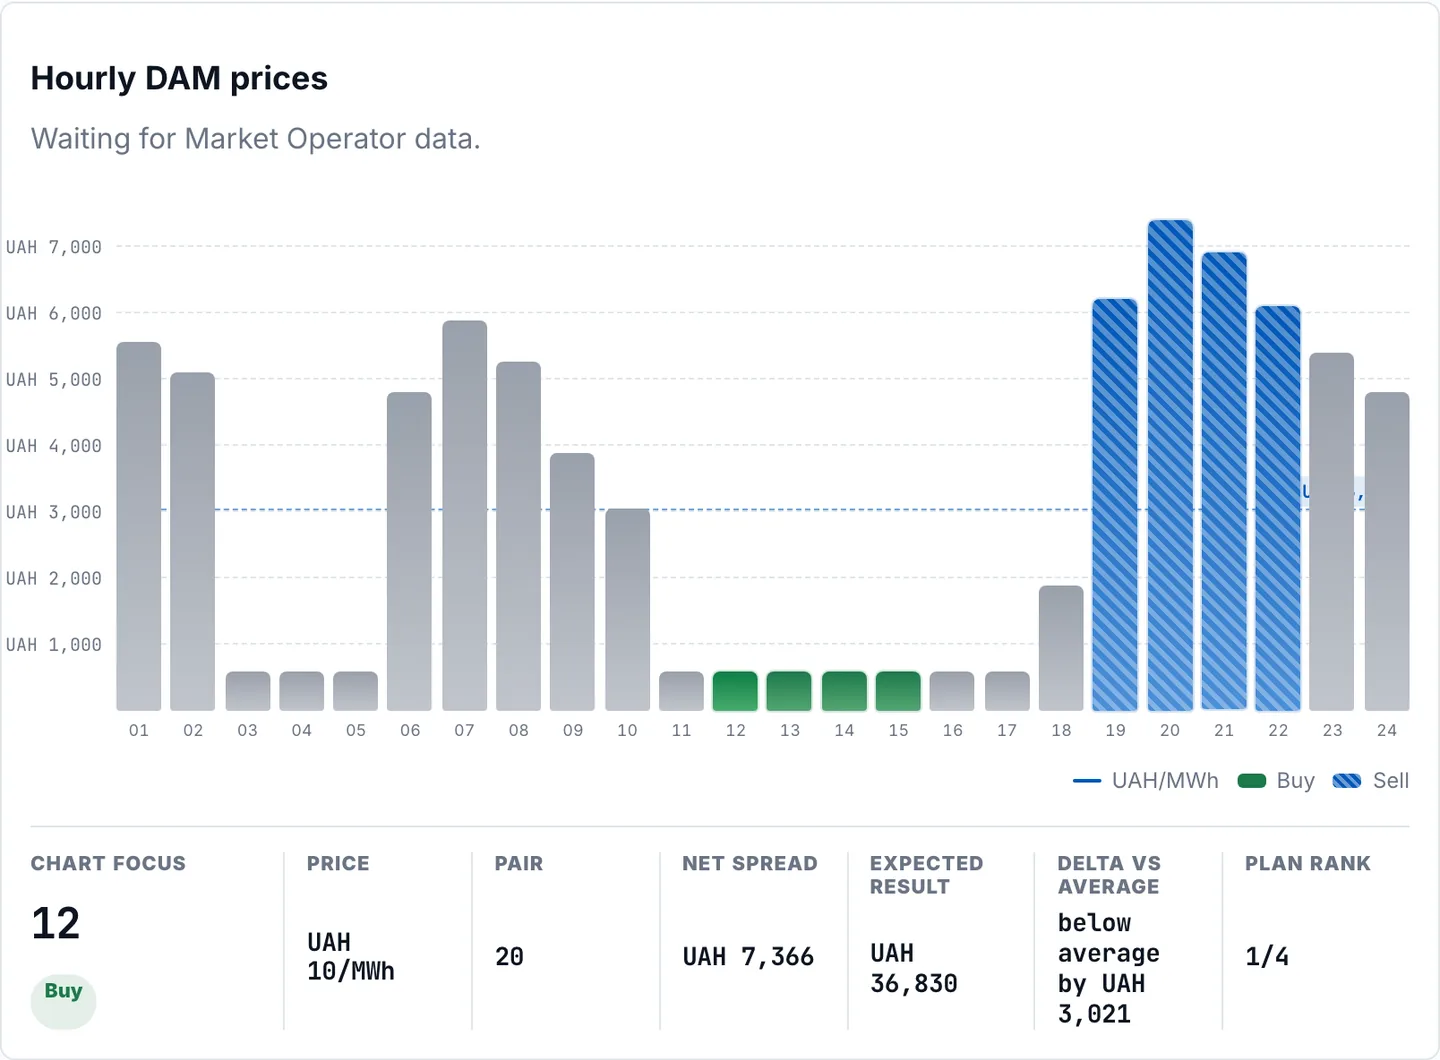
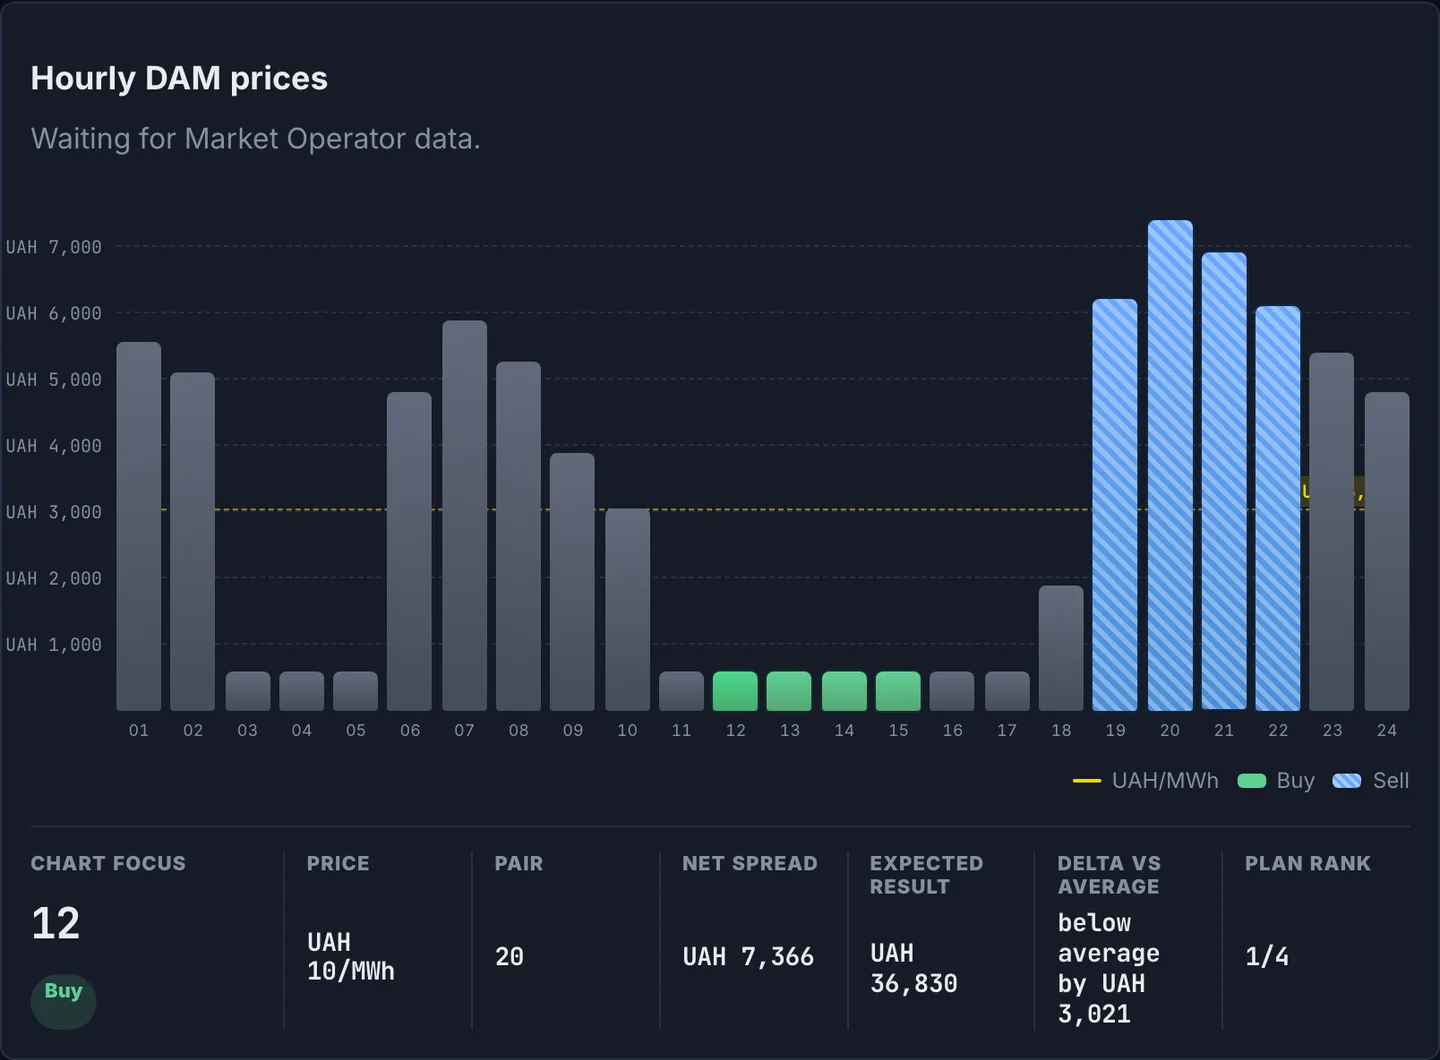
24 hours of official Market Operator prices with cheap (buy) and expensive (sell) hours marked, a P10–P90 forecast band, and a per-hour inspector.
- Scan the whole day: green marks are cheap hours, blue are expensive.
- Click any hour to open the inspector: price, delta vs average, forecast, and trade window.
- Switch DAM/IDM and check the forecast band and the model comparison with a simple benchmark.
Your margin is the spread: buy in cheap hours, sell in expensive ones. When a forecast is available, the workspace shows which model produced it and how it compares with a simple benchmark. The P10–P90 band shows scenarios, not a price-move guarantee; execution, liquidity, and imbalance stay separate checks.